Saturday, October 31, 2009

The Little Book That Beats The Market: Chapter 12

Joel Greenblatt, the book's author, is a value investor extraordinaire and a professor at Columbia's business school. In the book, Greenblatt discusses and justifies the "Magic Formula", a stock selection method that allows individual investors to beat the market using value investing.

In this chapter, Greenblatt warns about the pitfalls of following some of the other investment options that are available to individual investors.

First off, individuals may get direct stock advice from stockbrokers. While stockbrokers can help explain some elements of investing and probably do want you to succeed in the long term, investors must keep in mind that brokers make their money by selling something to the investor, not by the long term success of the investor.

Rather than relying on a broker, mutual funds or hedge funds offer a better alternative, because they are motivated by track record to a larger extent. Nevertheless, these funds make more money by becoming larger and larger (so they can charge fees for the size of the assets under management), which makes it more and more difficult to maintain strong levels of performance. Furthermore, after fees, most of these funds are bested by the market.

While there are good managers out there that can beat the market, there are many more who will not. Just as the magic formula can lose to the market in three-year periods, so too can good money managers. In the same way, poor managers can beat the markets over periods of such length. As such, it very difficult to identify a fund manager with whom one should invest.

Investing in index funds is therefore an option which allows investors to closely match the market's return. But that's all the investor can do with such funds: match the market. To beat the market, investor's should use the magic formula.

Friday, October 30, 2009

How Efficient Is Management?

One of the most important factors in determining whether a company is worth an investment is the quality of its management. Unfortunately, this assessment can at times be highly subjective. Reading interviews or comments from management can often be of little value. After all, management may have great communication or oratory skills, but that doesn't necessarily translate into good business execution. In fact, many value investors even prefer not to meet managements to avoid being influenced by factors unrelated to execution.

So how then to evaluate management? One way is to simply evaluate the financial results of their companies. Unfortunately, certain factors which manifest themselves in the financials may be out of management control. For example, competition in an industry and/or time period might be fierce, or a company may be at a brand disadvantage - not necessarily the fault of current management, so how do we differentiate across managements?

One method analysts like to use is to evaluate the number of days inventory a company has on hand. The lower the number, the more efficient management is (as cash is freed for other purposes, like paying shareholders)...as long as there are no stock-outs hurting revenues! The number of days of inventory a company has on hand can be estimated with the following formula:

inventory * 365 / COGS = days of inventory on hand

This number can be compared to that of competitors or the industry, with the caveat that differences in product mix must be taken into account. Below are average days of inventory for several industries as per the IRS:

A high days inventory doesn't necessarily mean bad management, however. But this concept can be extended to a company's days receivable and days payable. This can offer a clue as to how effective management is at running an efficient operation, which can translate into other facets of the business.

Thursday, October 29, 2009

Conn's Inc.

When Circuit City declared bankruptcy near the beginning of the recession, opportunities were created for other electronics retailers. One company that aggressively stepped forward to fill the void is Conn's Inc. (CONN), a home appliance and electronics retailer. Conn's even took over some of Circuit City's previous locations on its quest of aggressively growing its market share.

A quick look at the financial statements shows that Conn's has indeed been successful at grabbing consumers, with flat year-over-year sales (in an otherwise negative environment for consumer electronics) and decent profitability. In the last four quarters, Conn's has earned operating income of almost $40 million while the company trades for just $150 million on the market. The numbers are enticing until you consider how the company is making its sales: on credit.

Indeed, the company's "receivables" balance has increased from $30 million to $140 million in the last year, as the company counts the increase as sales and then subsequently counts on consumers to pay that money back (using repossession as an incentive). In the past, the company has sold these receivables to an off-balance sheet qualifying special purpose entity (QSPE) to fund these consumer financings, but the QSPE's funding is currently near its limit, requiring the company to show the difference on its balance sheet.

In principle, there is nothing wrong with a business that lends money to consumers to finance purchases. But investors must recognize that this is not a simple business: this is partly a retailer, and partly a bank, and therefore contains risks inherent to both industries. From a bank-type risk point of view, the company has had to take on $130 million in debt to fund these receivables; if consumers have trouble paying their bills, this spells trouble. From a retail-type risk point of view, the company has over $150 million in operating lease commitments; if the company can't find enough consumers that pay cash or that have good credit, this also spells trouble.

Reported sales numbers don't always tell the story. In this case, past sales numbers, however accurate they may have been at the time, may be covering for the fact buyers can't actually afford items they purchased on credit. On the other hand, it's entirely possible that the company is extremely accurate with its credit scoring system and its strategy will pay off in the long run. Either way, to avoid being surprised by the downside risk, investors must be aware that they cannot simply evaluate this company as a retailer alone, but must take into account the risks that are inherent in investing in banks as well.

Disclosure: None

Wednesday, October 28, 2009

What Does The Index Really Tell You?

We looked here at the Dow Jones Industrial Average, and saw why it's not a great measure of US stock performance, despite being a favourite index when it comes to media coverage. The S&P 500 is a much better barometer for the health of US stocks, though an understanding of its calculation methodology is important in order to understand the limits to its usefulness.

The S&P 500 is essentially a market-value weighted index*, meaning a company's influence on the index is proportional to its size. This much different than how the Dow Jones Industrial Average is calculated. Also unlike the Dow, the 500 stocks that comprise the index are chosen such that the index proportionally represents the economy's various industries. As such, the S&P 500 is not just the 500 largest companies. One interesting note is that despite being larger than almost every company in the index, Berkshire Hathaway is not a component of the S&P 500.

What does this mean for you? Basically if you invest in an index fund that mimics the S&P 500, most of your money is invested in the largest companies, thanks to the index's market-value weighting*. For example, the top 10 companies of the S&P 500 make up 20% of its value!

If you're a value investor like we are, and find more value in small companies than in large (for reasons discussed here), the S&P 500 neither looks like a good place to invest, nor does it provide a decent basis against which to compare one's returns, as it rises and falls with the largest companies.

While the S&P 500 is a useful indicator of the perceived health of the US economy, its usefulness as an investing and comparison tool is limited.

(*)Since 2005, this statement is only approximately true; Standard and Poors switched to only counting shares in its index that are available for public trading (as opposed to all outstanding shares).

Tuesday, October 27, 2009

Short-Term Value Investing?

At times, value investing can feel like trading. While value investors should always purchase with the expectation that a stock will be a long-term holding, some stocks can be so volatile that they go from offering a margin of safety to offering a reasonable price and back again within the span of a few weeks! And as Warren Buffett told us when we met with him last year, volatility (shunned as an undesired property by the mainstream finance industry) is the friend of the value investor.

For example, earlier this month we discussed how LCAV may have appreciated to a conservative estimate of its intrinsic value. But just three weeks following that article, its price had fallen by 40%, offering investors the opportunity to buy back in at depressed values!

There is no question that the near-term outlook for this company is poor: this is not a great time to be selling expensive, elective services to battered consumers, who are focused on paying down debt, saving money, and securing jobs. But this company has the ability to survive, with a strong net cash position and positive cash flow from operations through the first two quarters of this year.

But from a long-term business perspective, we have a company selling for $80 million that earned a combined operating income of $120 million in the three years that preceded this recession. While economic conditions are not likely to allow a return to those profit levels any time soon, the bleak near-term outlook is just the sort of stuff value investments are made from.

In a so-called "efficient market", it's hard to believe that stock prices can fluctuate so wildly. But as Joel Greenblatt notes in his book, stock prices do fluctuate enormously even within the same year. If investors can accurately determine that a company is trading for a discount to its intrinsic value, this volatility offers opportunities for excellent returns, sometimes within short periods of time.

Disclosure: Author has a long position in shares of LCAV

Monday, October 26, 2009

Ridley Inc.

Ridley Inc. (RCL) manufactures and sells animal nutrition products to North American meat, milk and egg producers. As such, it operates in a fairly stable industry, as demand for many feed products tends to hold steady through recessions.

Despite the stability of this industry, and Ridley's role as one of the larger players with $600 million of annual sales, the company is conservatively capitalized with only $13 million of debt compared to equity of $150 million. Meanwhile, the company trades for just $100 million, while it has brought in combined operating cash flow of over $60 million over the last four years.

While the company may seem attractive at these levels, the stock is rather illiquid, meaning institutional investors cannot realistically participate in this opportunity. The company is not that small compared to some of the other stocks we've discussed on this site, but what keeps the stock volume low is the fact that more than 9 million of the company's 14 million shares outstanding are held by Fairfax Financial (FFH), one of the best value-oriented firms out there, as we've previously discussed.

Like Dorel, RCL appears to be utilizing the recession to make acquisitions. The acquisitions should add value for shareholders, considering the fact that a value firm like Fairfax is a majority owner. For example, RCL's latest acquisition should allow it to sell its existing products to new customers as well as sell the target's products to RCL's existing customers.

So while most investors apply valuation discounts for both 1) stock liquidity and 2) controlling shareholders, for value investors with long term outlooks this stock could represent ownership in a business at an attractive price where the principal shareholder's views on stock ownership are aligned with those of the individual investor.

Disclosure: Author has a long position in shares of RCL

Sunday, October 25, 2009

The Little Book That Beats The Market: Chapter 11

Joel Greenblatt, the book's author, is a value investor extraordinaire and a professor at Columbia's business school. In the book, Greenblatt discusses and justifies the "Magic Formula", a stock selection method that allows individual investors to beat the market using value investing.

Despite the fact that the magic formula beats the market handily, Greenblatt recognizes that there are those who will not be satisfied with simply buying the basket of 20-30 stocks the formula spits out. This chapter offers advice to those individual investors who can't help but to pick stocks on their own.

Greenblatt starts with a warning:

"Choosing individual stocks without any idea of what you're looking for is like running through a dynamite factory with a burning match. You may live, but you're still an idiot."

After the warning, Greenblatt goes on to discuss some of the weaknesses of the formula, and how investors who do know what they're doing can improve their results.

For one thing, the formula considers last year's earnings when computing both the earnings yield and the return on capital. But last year may not be indicative of the company's earnings power, due to unusual occurrences. Therefore, Greenblatt suggests that people who know what they are doing can calculate 'normal' earnings for a company, and use that as a basis for earnings yield and return on capital, rather than simply using last year's earnings.

Even though the concept is simple enough, Greenblatt argues that predicting normal earnings is very difficult, and only those who know what they are doing should try it. As it stands, the magic formula works just fine even though it uses last year's earnings. This suggests that last year's earnings are reasonably indicative of earnings when a large enough basket of stocks is employed.

But for those who are capable of understanding the businesses they research and determining normal earnings, Greenblatt recommends a much smaller basket of companies. In fact, Greenblatt advises a basket of just 5 to 8 companies (as opposed to the 20-30 recommended for those using the magic formula) for those who know what they are doing.

So far, that covers those who know what they are doing and those who do not. But Greenblatt also has advice for those who don't know if they know what they are doing, but still want to choose individual stocks! For this group, Greenblatt suggests choosing between 10 to 30 stocks from the top 100 companies produced by the magic formula (as opposed to just choosing the top 30 stocks).

Saturday, October 24, 2009

The Little Book That Beats The Market: Chapter 10

Joel Greenblatt, the book's author, is a value investor extraordinaire and a professor at Columbia's business school. In the book, Greenblatt discusses and justifies the "Magic Formula", a stock selection method that allows individual investors to beat the market using value investing.

Greenblatt discusses the risk and return of the magic portfolio over the 17 years of historical data that he looked at. In some years (about 1 out of every 4), the magic formula underperformed the market. Over two-year periods, however, the magic formula improved its odds for beating the market, as it only failed to do so about 1 in 6 times. Over three-year periods, the magic formula never lost money and outperformed the market 95% of the time.

For this reason, Greenblatt argues that the magic formula operates with a low level of risk from the perspective of long-term investors. He rejects other measures of risk commonly used in the finance industry (e.g. standard deviation of returns), and instead chooses to measure risk by answering the following two questions:

1) What is the risk of losing money in the long-term, following the strategy?
2) What is the risk that this strategy will perform worse than the alternative strategies?

While the logic of the magic formula has been discussed in previous chapters, Greenblatt feels it necessary to assure the reader that stock prices do converge to the values of the underlying businesses in the long-term. Most of the time, this convergence takes place within 2 or 3 years. Sometimes, it can take weeks or months, while other times it can take years.

Some of the reasons prices will eventually converge to their values are: firm buyouts, other investors who see value, share buybacks etc. Greenblatt argues that in the short-term, Mr. Market can be quite emotional and offer crazy prices, but in the long-term he is mostly right.

Friday, October 23, 2009

Understand These Biases

Daniel Nevins is a managing director at SEI Investments. Not unlike Charlie Munger (whose discussion of human tendencies we have summarized), Nevins is a student of human biases which cause individuals to underperform as investors. In his paper titled Integrating Traditional and Behavioral Finance, Nevins notes the following biases:

Overconfidence
Investors overestimate their ability to predict market events. This leads to overtrading and taking on too much risk.

Hindsight
People become honestly deceived when an event occurs, thinking that they had predicted such event even when they had not. This trait reinforces overconfidence.

Overreaction
The human mind looks for patterns. But sometimes events occur which are random or cannot be predicted. Nevertheless, investors over-interpret patters that are coincidental, leading to illogical behaviour.

Belief Perseverance
People are unlikely to change their opinions once they have been formed, for two reasons. First, people are reluctant to search for evidence that contradicts what they believe to be true. Second, even when faced with such evidence, it is treated with skepticism or not given the weight it merits.

Regret Avoidance
This is a tendency to avoid or postpone actions that create discomfort. For example, investors hold on to losing stocks, as selling them would be a confirmation of a poor prior decision, and this confirmation does not sit well. (Note that Belief Perseverance can also play a role in this action.)

By understanding these biases, investors put themselves in a position to avoid falling prey to them. By recognizing that such tendencies may be playing a role in investment decisions, individuals can take steps to mitigate them or implement procedures for decision-making that are more objective.

For those interested in reading more on the subject, the full paper is available here.

Thursday, October 22, 2009

Approaching Book Value

Over the last year, we have discussed many stocks that have appeared to trade at significant discounts to their intrinsic values. But lately, undoubtedly due in part to the market's rally, we find ourselves discussing previously downtrodden stocks that are actually approaching their intrinsic values. The latest example of this is Melcor (MRD), a property developer and property manager in the western part of North America.

This company operates primarily in Alberta, a province rich in oil. When oil prices are high (low), Alberta's economy is strong (weak). While energy prices are volatile, the market's (over)reaction to energy prices appears to be even more volatile, as we saw when we looked at Melcor's price to book over the last several years. At that time, Melcor traded at a 40% discount to its book value. While it's book value hasn't changed, the market value of the stock has almost doubled, bringing it to a level near its book value!

One wouldn't value Microsoft or Intel based on its book value, so why place so much emphasis on book value when it comes to Melcor? While land and property prices do fluctuate to some extent, their book values act as a reasonable proxy to market value, particularly if the land was purchased recently. This valuation metric can be used effectively to value homebuilders, for example.

For Melcor, the value of its assets is probably higher than its stated book value. This is due to the fact that some of Melcor's properties were purchased long ago and their prices have therefore appreciated. This makes it all the more surprising that this company can trade at such a large discount to its book value. Even if property prices in some of its areas were to drop by 20% or more, there is no reason why Melcor should trade at just half of its book value! Yet the market provided such an opportunity just a few months ago, and will likely do so again in the future.

But for now, since Melcor has risen to a level commensurate with its book value, much of the upside potential in the stock is now gone. As such, some investors may choose to sell and deploy the capital to situations where great upside potential still exists.

Disclosure: None

Wednesday, October 21, 2009

Trusting Analysts

The herd mentality is well-documented outside the investment world. While it is not given much thought within the investment world (exceptions include discussions on the topic from both Ben Graham and Stephen Jarislowsky), it plays a large role in the investment decision-making process: investors feel much more comfortable buying stocks when they believe that others are also piling in. To that end, investors often rely on analysts, who are expected to be "experts" in guiding investors on stock selection.

But just how good are analysts at predicting the directions of stocks? A decent paper (though dated) is available here which discusses the difficulties in truly evaluating analysts. However, at the very least, if analysts were at all useful, they should be able to tell the difference between a company that has value and one that is about to go bankrupt. Yet these two very different realities in a company's status continue to baffle these "experts".

Consider how wrong analysts have been with respect to the future of certain companies just days before they have gone bankrupt. As a famous example, consider the case of Lehman Brothers. Just before it went bankrupt, there was not a single "sell" rating from any of the 19 analysts covering the company, as discussed here.

In fairness to analysts (and conversely in unfairness to investors), analysts are often confronted with conflicts of interest that may be preventing them from extolling their true opinions of a stock. So analysts might actually be better at stock prediction than we think. However, this makes them no more useful for investors, who should put little stock in what analysts say, and should instead do their own homework, in the same way as they would for any investment outside of the stock market!

When investors buy property as an investment, they consider items like the property's ability to earn rent, and the risk factors with respect to that rent. Investors don't just heed the advice of 3rd party brokers and agents. The investor mindset with respect to stocks should be no different.

While most of the information we hear about particular stocks does come from analysts, there are other avenues investors can utilize. For example, Jonathan Goldberg's site now includes a forum where like-minded value investors can discuss various topics, including stocks. By discussing the aspects of companies which value investors find relevant (balance sheet strength, margins of safety, long-term earnings etc.), investors can avoid following the mainstream herd.

Tuesday, October 20, 2009

Apple's Soar Means Future Sores

Once again, Apple (AAPL) impressed investors with results that handily beat analyst expectations. The company continued to move iPods en masse, and sold a record number of Mac computers and iPhones, staunchly defying the drag on consumer spending that has been the bane of this economy.

There can be little doubt that Apple is a well-run, exceedingly competent company. That much can be determined with a quick look at the company's financial statements, where equity returns of around 25% are commonplace. What makes those returns even more impressive is the fact that no leverage is employed in garnering these exceptional returns: Apple has no debt!

While this means the company itself operates with very little risk, that does not automatically translate into a low risk investment. That's because it's important for investors to be able to separate a great company (which Apple clearly is) from a great stock. What makes a stock great is a price that allows investors to buy the business at a significant discount to its intrinsic value.

Is Apple a great stock? That will depend on the value of its business. For a company that grows sales and profits as quickly as Apple does, the value of its business is very difficult to determine with any degree of precision. There will be wide-ranging opinions on what earnings will be next quarter, let alone next year or the year after, making predictions of Apple's business value a difficult venture to say the least.

But what is clear is that as the stock price soars in reaction to near-term profit expectations (e.g. upcoming product launches, or increased distribution of existing products) or the expectation that near-term upward price momentum will continue, downside risks for the investor increase. Twice in 2008 (once in January, and once in the fall), Apple's stock fell by 40%. This was not an indictment of the company, but rather it highlights the risks of owning a company (no matter how great it is) at a price that makes it difficult to determine whether it is indeed under- or overvalued.

Large, institutional investment firms often have no choice: there are a limited number of large companies from which to choose, and often investments are made when it is far from certain that there is value to be had. For individual investors, however, there are far better investments available (from a value point of view), where downside risk is minimal and upside potential is strong.

There are many smaller companies out there that trade at discounts to their inventories, discounts to their receivables, or discounts to their land holdings. There are even more companies out there that trade at discounts to their earnings despite the fact that they are market leaders in their categories.

Apple's stock holds a special place in the heart of many individual investor accounts, not only due to the well-loved consumer products the company produces, but also due to the fact that it is a superior company that continues to defy expectations. But investors must keep in mind the fact that price and value are two different things: just because Apple's business value is high, does not mean one should be willing to pay anything for the stock. Investors are encouraged to put a business value on Apple, and if they cannot assert that they are buying the stock at a discount to that value, they should avoid the downside risk that may be present in the stock price by considering companies that appear to trade at discounts to their intrinsic values.

Monday, October 19, 2009

What Do They Actually Earn?

Companies are required to release their financial results according to GAAP. Often, however, companies will also release what they call "Pro Forma" statements, where certain "one-time" costs are often removed. These statements, managements say, better reflect the earnings power of the company. However, investors are urged not to take managements word, but rather to consider the "one-time" costs to make their own determinations as to whether these apply in the future.

For example, managements have often excluded early plant retirement costs or losses on the sales of equipment from pro forma statements. While these items may not occur annually, the investor must apply business sense to determine if these are likely to re-occur.

For example, does the company compete in an industry rife with technological change? If so, early plant retirements may be part of the cost of doing business. Does the company often have to sell equipment below book value? Management may be using a depreciation schedule that makes earnings look higher than they should be.

The best way to include non-recurring yet real business costs is to average out several years worth of earnings, as discussed in Chapter 37 of Security Analysis by Ben Graham and David Dodd.

As an aside, many companies have also used pro forma statements to exclude the expensing of stock options, which is now required by GAAP. As we discussed here, options have real value, and to avoid expensing them misleads investors about the true costs of operating the business.

The term "one-time costs" suggests investors need not concern themselves as these are unlikely to re-occur. Unfortunately, in many industries and companies, "one-time" costs are the norm rather than the exception. As such, investors need to strongly consider and account for the items that managements suggest should be ignored.

Sunday, October 18, 2009

The Little Book That Beats The Market: Chapters 8 and 9

Joel Greenblatt, the book's author, is a value investor extraordinaire and a professor at Columbia's business school. In the book, Greenblatt discusses and justifies the "Magic Formula", a stock selection method that allows individual investors to beat the market using value investing.

While the Magic Formula appears to work over the long-term, Greenblatt discusses reasons why it is not used by everybody. He considers it good news that the formula doesn't work in many periods, as this prevents people from exploiting it and thus reducing its returns.

For example, the formula is outperformed by the market in 5 months out of every 12 (for the 17 year period Greenblatt tested). It can even underperform for years in a row, as at one point in the simulation it underperformed for three years in a row. This makes it very difficult for fund managers to employ it consistently. Greenblatt cites examples of various value fund managers he knows who lost large chunks of clients or who even closed down shop after underperforming for years, only to eventually emerge with far superior returns in the long run. The pressure on fund managers not to underperform their peers forces them to make decisions that are not in the best interests of their funds in the long term.

But to be able to stick to the formula, Greenblatt argues that investors must understand why it works. The bottom line is that by employing the formula, investors are buying stocks with the best combination of returns on capital and earnings yield. High returns on capital suggest a business has an advantage or position which allows it to make abnormally high profits, and a high earnings yield means investors are paying relatively less to buy each dollar of earnings. This combination is logical, and so it makes sense that the formula would work in the long-term.

Saturday, October 17, 2009

The Little Book That Beats The Market: Chapter 7

Joel Greenblatt, the book's author, is a value investor extraordinaire and a professor at Columbia's business school. In the book, Greenblatt discusses and justifies the "Magic Formula", a stock selection method that allows individual investors to beat the market using value investing.

In this chapter, Greenblatt speaks to the skeptic who doesn't believe the formula described in the last chapter. To that end, Greenblatt identifies possible pitfalls of using the formula, and attempts to disprove them.

First, he uses the past data to ascertain whether these results could indeed have been realized. For example, if the formula only showed great results because the simulation model used prices of small, illiquid stocks, then it may not be very useful. But Greenblatt ran the formula against markets of all sizes, and found that it beats the markets handily even among large caps.

Second, Greenblatt discusses whether the formula could have been lucky. After all, one could use historical data to come up with several winning strategies, but that doesn't mean they will work going forward, as they could be the result of coincidence. Considering the size of the sample Greenblatt employed (number of stocks over number of years), he does not believe the formula to work as a result of luck.

Finally, another possibility is that the market could wise up going forward, and no longer offer the top 30 stocks (as ranked by the formula) at such a large discount. If those 30 are no longer available, is the formula useless? To counter this theory, Greenblatt divided the stock universe (in his study) into deciles. He found that the deciles outperformed each other exactly as expected. In other words, the 4th ranked decile outperformed the 5th ranked decile, the 5th ranked decile outperformed the 6th ranked decile etc. This suggests the formula works on the general market, and does not require a special group of 30 mispriced securities (which is considered the 1st decile).

Friday, October 16, 2009

Comebacks

In a previous post, we discussed how as a result of circumstance, companies can go through tough times and good times that don't correspond with the economic cycle. Companies that had difficulties turning a profit in the strong economic period that preceded this downturn could go in one of two directions:

1) they could become companies mired in secular decline, unable to adapt to the current business environment, or
2) they could find a way to adapt and emerge as stronger companies.

As an example of the latter, consider Audiovox (VOXX), which sells consumer electronics and accessories. Prior to the recession, Audiovox had some trouble turning a profit. This served as an early wake-up call, forcing the company to focus on cutting costs and exiting lower margin products. While this had the effect of reducing revenue, the intention was to become a healthier, more sustainable business.

When the recession hit, Audiovox was already in the process of cutting its fat, whereas other companies were only just beginning. As a result, while many of its competitors are currently still losing money, Audiovox has now turned a profit for two quarters in a row.

Amazingly, while the stock has almost quadrupled since its March lows, it still trades at a discount to its net current assets. By finance industry standards, the company is "risky" due its high beta above 2. But from a value investor's perspective, the company's business risks do not appear onerous. The company offers a diverse range of products, and sells these products to a relatively diverse group of customers.

In addition to the discount to net current assets at which the company trades, the investor is offered the company's equity investments, investment securities, land, and intangible assets for free! But don't take my word for it; interested in another perspective on VOXX, or another stock you have your eye on? One of our sponsors, INO.com, offers our readers a free analysis of a stock of their choosing here.

Disclosure: Author has a long position in shares of VOXX

Thursday, October 15, 2009

S&P Price To Book

Investors will often look at the P/E ratio of the S&P 500 in order to gauge how expensive stocks are. Earnings, the denominator of that equation, are quite volatile, however. In a year like this one, where massive write-downs plague income statements, it is difficult to determine the market's true earning power.

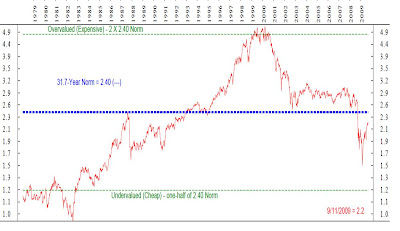
Another method to gauge investor sentiment, though not nearly as popular, is the market's price to book ratio. Unlike earnings, book values are not nearly as volatile (unless of course, you are an over-leveraged bank), and therefore they can give us a decent indicator of how the market is valuing company assets. Courtesy of Comstock Partners, here is the price to book value of the S&P 500 over the last 30 years (original version here):

There are a couple of interesting observations to note in the above chart. First, on a price to book basis, during this recession the market did not fall to the depressed levels seen in the late 1970s. Second, the market's price to book value currently appears to be fairly close to its 30-year average (denoted by the horizontal blue line), despite the fact that the outlook for economic growth appears tepid.

Of course, there are a number of factors that make historical comparisons of price to book values difficult. Accounting methods of how book value is calculated have changed over the years, with an increasing trend towards making book value better reflect market value. Furthermore, there has been a shift when it comes to industries in the S&P 500, with manufacturing companies playing a decreasing role while knowledge-based companies (e.g. software, consulting, other services etc.), where hard-assets are not a determining factor, comprise a larger portion of the index.

For the above reasons, long-term comparisons of historical price to book ratios can be problematic. Nevertheless, investors can look at the price to book ratio over recent periods as a decent gauge of investor sentiment. Clearly, price to book ratios fell dramatically from their 2008 highs, but a large rally has resulted in a recovery of a significant portion of those losses. The above chart won't tell you where the price to book ratio will go, but it will tell you that investor sentiment has recovered to a large extent and that downside risks have increased as a result.

Wednesday, October 14, 2009

Borrowing To Buy Stocks

Margin debt on the NYSE can be a useful indicator of how Mr. Market is feeling. If optimism is high, people tend to borrow more to buy stocks. Previously, we've seen how margin debt through the last recession fell mightily and did not return to its previous highs for several years. Through last year and the first part of this year, it looked like margin debt would follow a similar path.

In the last six months, however, investor appetite for risk appears to have returned, with margin debt making a small comeback. Here is a look at the use of margin debt on the NYSE through August of 2009:

While margin debt is still well below its 2007 high, it has surprisingly not fallen to the lows seen in 2002. Indeed, margin debt levels are now at 2005 levels and appear poised to continue their ascent: these numbers are through August; as the market rose through September, it is likely that margin debt continued to increase further.

If we look at the ratio of margin debt to the index level of the S&P 500, we see that debt as a percentage of the market remains historically high, at least compared to what it was in the last recession:

The proliferation of hedge funds over the last decade is likely at least partially responsible for this increased willingness to purchase stocks with debt. Nevertheless, investors should take note that a relatively high proportion of the market's capitalization is currently financed by debt, suggesting that there is a significant amount of downside risk to the market if these debt positions are forced into liquidation.

Tuesday, October 13, 2009

Timing The Market

Many participants in the stock market base their buy and sell decisions on attempts to time the market. The idea is to buy into the market just before prices rise, and sell before they decline. Many studies have shown that it is very difficult to correctly time the market. But assuming you had superior foresight, how often would you have to be right in order to beat a buy and hold investor?

Chua, Woodward and To took an interesting approach to this question. Using a mean market return of 12.95% and a standard deviation of 18.30%, the authors ran 10,000 simulations of market years where an investor has an assigned probability of correctly determining a bull or bear market. If said investor guessed a bull market, he was credited with the market's return. If the investor guessed a bear market, he was given the T-Bill rate of return. The buy and hold investor always received the market return.

The results were surprising. In order for a market timer to beat the buy and hold investor on average, he had to correctly predict a bull or bear market a full 80% of the time! The authors concluded that the cost of an investor missing out on bull markets was quite high. Timers lost much ground in the years that the market did well where the timers incorrectly guessed a bear market.

However, the standard deviation between the timer and the holder was quite wide, suggesting that many market timers will indeed outperform the holders, and this is the case even at a 50% probability of a correct prediction. As such, timers who are successful will be promoted and we are sure to continue to hear about timers who have beaten the markets. Whether the outperformance as a result of timing is sustainable or simply the result of random distribution is another story. On average, being right 80% of the time would appear to be quite a stretch.

Monday, October 12, 2009

From The Mailbag: Matrix Service

Matrix Service Co. (MTRX) provides construction and repair services to companies in the oil and gas sector. Considering its highly cyclical industry, it has held up well through the recession, with profits actually increasing in 2009 vs 2008. As a result, its stock trades at a premium to book value (P/B = 1.5) with a P/E of 9.

Its revenues have held up due to the fact that almost half of its sales comes from its repairs segment, which is much more stable than its new construction segment. Furthermore, revenue stability is helped by the fact that the company often operates with long-term contracts. But going forward, revenue is almost sure to continue to decline: construction backlog is down some 30% from last year.

Nevertheless, the company has a pristine balance sheet, with a debt to equity ratio (including operating leases) coming in at less than 10%. As a result, the company is positioned to outlast the downturn, despite the expected drop in revenue.

Considering the above factors, this appears to be a worthy investment for a regular investor. For value investors, however, there are some noteworthy factors to consider. First of all, the company's price does not appear overwhelmingly cheap. While the P/E is 9, we know that earnings should reduce in the future due to the fact that customers are now more hesitant to invest in new construction (as shown by the backlog numbers).

The premium to the price to book is also a concern: if there are outsized profits to be had, competitors will be compelled to provide the same services, driving down margins. Investors paying a premium to book value must be sure to understand the competitive advantage or moat this company has that prevents the competition from eroding profits. Not being an expert in this field, I do not.

Secondly, the company is exposed to the oil and gas sector. We've previously discussed the fact that commodity cycles can be unpredictable, exposing the investor to downside risk if oil prices were to move in an unfavourable direction.

Finally, the company's customers are concentrated, with the top three customers accounting for 30% of the company's revenue. Reliance on just a few customers always presents an added risk.

While Matrix may be a great company with excellent potential, value investors should ensure they understand the risks before investing. Exposure to commodities, reliance on a few customers, current returns which invite competition, and a price which does not appear to offer a terrific margin of safety all have the potential to derail what otherwise looks like a decent investment.

Disclosure: None

Sunday, October 11, 2009

The Little Book That Beats The Market: Chapters 5 and 6

Joel Greenblatt, the book's author, is a value investor extraordinaire and a professor at Columbia's business school. In the book, Greenblatt discusses and justifies the "Magic Formula", a stock selection method that allows individual investors to beat the market using value investing.

In these chapters, Greenblatt introduces two concepts which form the foundation of the Magic Formula: earnings yield, and return on capital.

Earnings yield is simply earnings divided by price. If a company was for sale at a certain price, a buyer would hope its earnings are high (relative to the price), not low. As such, a high earnings yield (or conversely, a low P/E) is desirable.

Return on capital is the money that a company receives from investing its own money. A company that can generate a higher return on capital is more desirable than a company that generates a low return on capital. A company that generates a return on capital less than the risk free rate is actually destroying capital.

By owning businesses that trade at high earnings yields and that have high returns on capital, investors will beat the market. To demonstrate this, Greenblatt examined the results of owning approximately 30 stocks with the best combination of earnings yield and return on capital over the last 17 years (since that's how far back the Compustat "Point in Time" database went back). The portfolio returned 30.8% per year, compared to 12.3% for the overall market.

How were these portfolios constructed? All stocks in the market were ranked by the two criteria described above. The rankings were then added together. The top 30 combined-ranking stocks were considered the portfolio for the purposes of this study.

Saturday, October 10, 2009

The Little Book That Beats The Market: Chapter 4

Joel Greenblatt, the book's author, is a value investor extraordinaire and a professor at Columbia's business school. In the book, Greenblatt discusses and justifies the "Magic Formula", a stock selection method that allows individual investors to beat the market using value investing.

Every year, Greenblatt starts his first lecture to his graduate class at Columbia Business School in the same way. He asks students to yell out companies, and he subsequently looks up the 52-week lows and highs of these companies' stocks. For every company, he finds large differences between the highs and the lows. For example, in the year that preceded his publication of the book, the following companies could be purchased at the following prices:

General Electric: $29 to $53
General Motors: $30 to $68
Abercrombie: $15 to $33
IBM: $55 to $93

These stocks were not chosen because of their wild price swings. Instead, their price swings are typical of many companies on the stock market. In such a short period of time, how can it be that such large, well-recognized, widely owned companies fluctuate in value so dramatically? Did GM all of a sudden make half/twice as many cars as it did a few months ago? Unlikely.

There are entire fields devoted to figuring out why and how these fluctuations take place. Greenblatt argues that much academic effort has been expended trying to explain "why something that clearly makes no sense, actually makes sense."

Greenblatt doesn't care why it happens. The point is that it does, and that's what allows you to profit. He goes on to discuss Mr. Market, and how you should buy from Mr. Market when he is offering you bargains, and sell to Mr. Market when he offers you a good price.

Friday, October 9, 2009

Karsan Value Funds: 2009 Q3 Results

Karsan Value Funds (KVF) is a value-oriented fund, as described here. Though many readers have expressed an interest in investing, due to securities regulations the fund is not open to the public at this time. Should that change in the future, there will be an announcement on this site.

For the third quarter ending September 30th, 2009, KVF earned 79 cents per share, bringing the value of each share to $10.82. The markets had a very strong quarter, buoying funds of all types, therefore these earnings should not be considered particularly exceptional. The true test of whether this fund is adding value will take place over a several-year period that includes both bear and bull markets.

Hindering performance this quarter was the weak US dollar, which reduced the value of KVF's US investments as measured in Canadian dollars (which is KVF's reporting currency). Had the US dollar closed this quarter at the same value at which it opened the quarter, earnings this quarter would have been 38 cents per share higher. As explained previously, there are no plans for KVF to hedge its currency positions, and as a result currency movements can have a material effect on quarterly results, but are not likely to be a significant factor over the long term. While the weak US dollar has hurt this quarter's results, it has allowed KVF to buy US stocks with a strong Canadian dollar, which will likely help results over the long term.

Aiding results this quarter were exceptional price run-ups in two stocks in which the fund now no longer holds any positions: LCA-Vision and Twin Disc.

Looking ahead, the market run-up has increased the downside risk and reduced the upside potential of the indices. However, in my opinion KVF still holds several securities at exceptional prices. Hopefully I am correct and the fund will benefit from these price discrepancies in the coming quarters.

KVF's income statement and balance sheet are included below. Note that securities are marked to market value.

Thursday, October 8, 2009

Intrinsic Values

A couple of readers recently asked me for my valuation numbers for a particular stock. The fact that I declined to divulge that information led to a few e-mails asking if there was a particular reason I was not willing to share such info. As such, I thought it best to share my thoughts on the subject with a post.

First of all, I don't want to get into debates with readers about the calculation of various components that form part of a valuation. Everyone will have their own opinion when it comes to valuation, and that's okay, as the purpose of this blog is not to converge on a single opinion but rather to discuss the relevant issues that can have an impact on a valuation. If I had to spend time discussing/debating/describing each of the various inputs that form part of my valuation, I wouldn't have enough time devote to more productive endeavours.

Furthermore, by sharing my valuation numbers, I am also opening the fund up to competition. Many of the stocks discussed on this site are not liquid, but even for the ones that are, I open the fund up to front-runners: if readers are buying/selling ahead of me because they know my valuation, I'm doing a disservice to the fund's shareholders, which is not acceptable.

Also, while it would be nice to be right all the time, I am far from it. As such, I have no interest in opening myself up to future scrutiny for the stocks which just don't work out. The fund is intended to be used to judge performance, not individual securities whose returns can be taken out of context and for which someone may hold me liable.

Finally, one of the major themes of this site is that individual investors should learn how to make their own investment decisions, and not just count on the musings of analysts. If I was displaying my own valuations, I would be subtly encouraging readers to take it and run with it. This doesn't make me much different than the analysts we criticize, or the google ads that appear in the top banner of this page, where advertisers offer "hot penny stocks" and other items designed to acquire your e-mail address. While I'm happy to profit off of them by way of reader clicks (and I thank the reader for those, as they form a significant portion of the site's modest income), I don't aspire to become them.

Happy investing!

Wednesday, October 7, 2009

Interim Updates

Investors commonly rely only on quarterly and/or annual reports to evaluate a company. But occasionally, companies will issue press releases or interim reports that can be valuable. Important and material information is often contained in these reports, and investors can often use this info to determine whether things are going as expected. Consider Quest Capital (QCC), a mortgage lender with very little leverage.

We discussed Quest as a potential value investment three months ago. For this stock to realize its price potential, one of the key success factors is that loan losses (i.e. mortgage debts that customers can't pay) do not come in well below management's estimates. The company has stopped issuing new loans for the most part, so if things are going as planned, cash should be coming in at a decent clip, adding to the company's safety and liquidity.

Last week, the company issued a release with some details describing its intentions towards its preferred shares. First of all, the company declared that it has paid its quarterly preferred dividend in cash. While this may seem non-newsworthy, the company actually has the option of paying this pref dividend in common shares, and it did so just two quarters ago. The fact that it has paid cash for the 2nd straight quarter suggests the cash flow situation is under control.

More significantly, however, the company also described some details with respect to restructuring the terms of its preferred shares. The company paid an upfront cash fee (again, suggesting its cash flow situation has improved) to lower the dividend it now has to pay on its preferred shares and for the right (but not the obligation) to redeem its preferred shares early. The pref dividend was 13.5% (now 12.75%, to be lowered to 12% in three months), as these shares were issued at a time when the company was in dire need of cash. But the fact that the company appears to be focusing on reducing and redeeming these preferred shares for cash suggests that the cash flow situation appears under control.

With the info provided by press releases and interim reports, investors can fine-tune their assessments of a stock's value that was likely primarily derived from the company's annual and quarterly reports. Subtle or not-so-subtle hints in such reports can help confirm or deny an investor's thesis.

Disclosure: Author has a long position in shares of QCC

Tuesday, October 6, 2009

Quick, Corny Returns

Even though I have studied the market's history, followed many companies for years, and back-tested companies' historical values against their historical stock prices, I am still amazed at how quickly prices can change in the market. Even though I have seen it occur countless times in the past, material price changes occur so frequently and with such speed such that they can still shock me. Consider Acorn International (ATV), an infomercial marketer.

Less than one month ago, we discussed ATV as a potential value investment. It traded for less than its cash on hand, and did not have a controlling shareholder, meaning shareholders could force a payout if need be. Indeed, discussion in the latest quarterly conference call suggested shareholders were becoming impatient and were getting closer to demanding the cash be paid out. But even if management decided to keep the cash within the company, investors still appeared to be buying a business at a substantial discount, as the company has been close to breaking even despite the recession.

The stock hovered around $4 per share for most of the last month. Then, last Thursday, Roth Capital Partners initiated coverage, and estimated the stock's value at $8 per share. Over the course of the next few days, the stock rose by over 50%, and spent parts of yesterday above $6 per share. At that price, the stock no longer traded at a discount to its net current assets, and no longer traded at a substantial discount to a conservatively estimated intrinsic value, offering investors the opportunity to lock in tremendous gains in a very short period.

Sometimes, it can take years or months for a stock to return to its intrinsic value. Other times, like in this case, it can occur over the course of just a few days. In either case, the lesson is the same. Buy businesses trading at discounts to their conservatively estimated intrinsic values, and you protect your downside risk and increase your upside potential, no matter what the period of time involved.

Disclosure: None

Monday, October 5, 2009

Margins Margins Margins!

We often talk about profit margins on this site. Analyzing the profit margins of a company can help you determine its profitability relative to its competitors. For example, if two competitors have equal net incomes but one has twice the profit margin of the other, then over time we may see the more efficient company steal market share and grow at a faster rate. (This can happen for several reasons, one being that it can simply lower its prices until its competitors are no longer profitable, thus dominating the market.)

One type of profit margin is a company's gross profit margin, which is its gross profit divided by its revenue. Gross profit gives a pretty good indication of a company's pricing power versus its product costs. In a previous post, we saw that Coke has a gross profit margin of 64%, indicating
people are willing to pay quite a bit more for Coke's products than it costs Coke to produce them.

While Coke has been able to sustain a strong margin for a long period of time, for most companies, attractive margins don't last long. This is because competitors are attracted to industries where profitability is high. To illustrate this, consider the net profit margins of the industries depicted below as they were in 2005:

Notice the high profitability of financial and energy companies. This high profitability in the finance industry is likely one reason that all sorts of new financial products and structures came into being: profits were high, and therefore the industry grew by pushing product proliferation to new heights. In the energy sector, the strong profits depicted above helped spur new oil exploration and new investment in alternative energies. In the past, this has led to increased oil supplies and reductions in the cost of energy, though these changes have taken time. While it remains to be seen if this process will occur once more in the next few years, it remains a distinct possibility.

When analyzing a company, be sure not only to consider its net income, but also the profit margins that contribute to that income. Compare the margins to competitors, and consider whether the company has a "moat" that can protect its margins from the competition. While margins are important, note that they are not the end-all be-all when it comes to profitability, as they don't consider asset utilization. A company able to generate revenue and income on fewer assets is preferable to one that constantly needs capital infusions to grow.

Sunday, October 4, 2009

The Little Book That Beats The Market: Chapters 1, 2 and 3

Joel Greenblatt, the book's author, is a value investor extraordinaire and a professor at Columbia's business school. In the book, Greenblatt discusses and justifies the "Magic Formula", a stock selection method that allows individual investors to beat the market using value investing.

Greenblatt starts the book with a discussion about buying a hypothetical business. Basically, the value of a business is the cash it is going to generate over its lifetime, with money that arrives in the future not quite being worth money in the present (since money in the present can be lent to the government for a "risk-free" return and therefore would be worth even more in the future). The concept of how much to pay for a business is briefly discussed. If a business is presumed to be worth $1500, then it makes no sense to pay $1500 for that business since you already have $1500 in hand!

In Chapter 2, Greenblatt discusses at the importance of saving and, at a high level, the various places individuals can store their cash. He discusses the various benefits and drawbacks to storing money in mattresses, banks, as loans to businesses and as stock in businesses.

In the third chapter, the reader is taken through an example income statement. The income of the company is then compared to the offering price for the company, and concepts like earnings yield are discussed. Greenblatt asserts that since the business has risk, the earnings yield should be higher than the risk-free rate (i.e. what the government would pay for your money). But of course, the income statement only looks at past data, but what's important is what the yield will be next year and beyond.

Greenblatt assures readers that discussion of the magic formula is coming up, but that these concepts had to be discussed first for the novice.

Saturday, October 3, 2009

The Dhandho Investor: Chapter 17

Mohnish Pabrai is an Indian-American businessman and investor. For a number of years, he turned heads with the performance of Pabrai Investment Funds since its inception in 1999. Pabrai has high regards for Warren Buffett and admits that his investment style is copied from Buffett and others. Over the next few weeks, we'll be exploring the topics in his book about value investing.

In this, the final chapter, Pabrai begins with a fable that illustrates the importance of focusing on companies within one's circle of competence. Investors can pick and choose from hundreds of thousands of companies (both public and private), real estate, currencies, mutual funds, options, hedge funds, treasuries, commodities and other investments. If the investor were to try his hand at all of them, he is not likely to do well. But by focusing on simple, easy-to-understand businesses, the investor increases his odds.

To that end, Pabrai advises investors to look only for opportunities that meet this criteria. Once an opportunity appears, study it closely, vet it, and make sure it's trading at a discount. "Do not make the fatal mistake of looking at five businesses at once," Pabrai argues. One should fixate on one company at a time, and only when the analysis is complete is one ready to look at other companies within the circle of competence.

While the book has been aimed at teaching readers how to maximize their wealth, Pabrai argues that there is more to life than money. A life focused only on increasing material wealth is not fully rewarding. Pabrai concludes the book by urging those who find success in Dhandho investing to give some of their wealth to those who are not so fortunate.

Friday, October 2, 2009

Analyst Consensus

Almost exactly one year ago, Washington Mutual basically declared bankruptcy, resulting in shareholders losing pretty much their entire investments. A day before the bank went down, here's what analyst recommendations looked like:


Though it makes little sense that there were so many "hold" recommendations, at least a good number of analysts rated it a "sell". This represents an improvement over analyst recommendations for Lehman Brothers as it went down.

There are a couple of interesting notes, however. Goldman Sachs upgraded WaMu about 2 weeks before it went down. "Capital and reserves appear to be stable," wrote analyst Brian Foran.

Fox Pitt, a firm that "provides clients with equity research and capital markets expertise", actually had this rated "Outperform" as it went down, according to Yahoo! Finance.

The bottom line? When you invest, know what you're buying; the "experts" have their own agendas.

Thursday, October 1, 2009

When Price Meets Value

To the dismay of those who abhor repetition, LCA-Vision (LCAV) has gotten a lot of airtime on this site as a potentially undervalued stock. But finally, that potential has manifested itself into reality, as LCAV has nearly tripled in price from when we first jumped on its scent some 10 months ago.

For those who have grown tired of hearing us rave about this stock, your day has come. At the price it hit last week, LCAV will no longer be brought up as a stock with value potential; instead, it gets moved to the "Value In Action" page, where examples of stocks that go from under appreciated to reasonably appreciated reside!

LCAV's price appreciation did not follow a linear ascent, however. LCAV would fall to just $2 per share in March, a full 33% below the $3 it was when we first discussed it as a potential value play. But despite the price drop, the value had remained steady: the cash balance was preserved and was higher than the company's market value, the competition was shutting its doors, and the company was cutting its costs. As such, despite the drop in price, the company offered downside protection to investors in the form of its assets.

As consumer confidence returned however (and demand for LCAV's service is related to consumer confidence), investor sentiment has shifted. The stock is up 100% in the last 3 months, and is at a level where the upside has been decidedly reduced. As such, it now appears to be a good time to cash out and hunt for the next potential value investments.

Disclosure: None